Here's a summary of this initiative! You can also scroll down for more :)
Company & status quo product
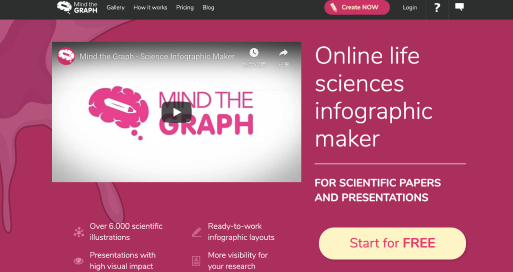
Mind the Graph is a global EdTech startup, backed by Samsung and founded in the US with the goal to match scientific knowledge and graphic design expertise to make the communication of experiments, clinical trials and complex education topics effectively and easy-to-understand across the scientific, academic and educational communities.
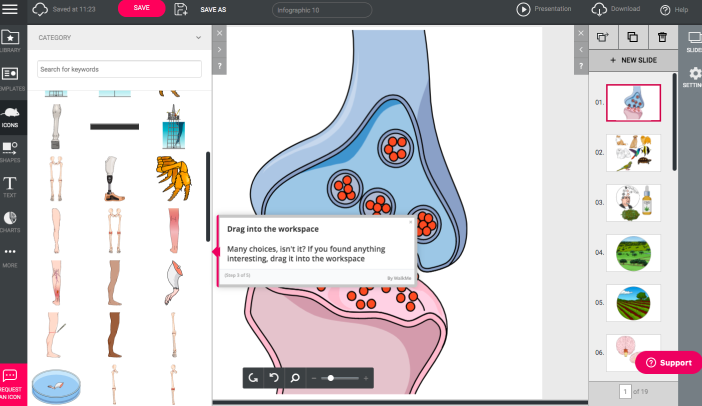
The company's core product - the online scientific infographic maker and illustrations database based on monthly and yearly subscriptions - served at the time over 100,000 customers from 30+ countries, focused on academic researchers, industry professionals, and educators from top university departments and pharmaceutical labs.
The core business model validation and the digital tool service had been fairly successfully running through an MVP launch and further feature-centric product development for the previous couple of years, but further growth and scalability were proven harder to achieve. The team realized it was now time to scale the SaaS services to ensure market competitiveness on the long run.
The challenge & what I brought to the table
I was brought in 2019 as the growth product manager and UX designer to join a diverse early-stage startup team made of software engineers with creative development skills, consulting scientists, content marketers, support specialists, and experienced graphic designers.
They were enthusiastic and full of valuable ideas, but were struggling to reach alignment on how to proceed next and build an effective relationship with a larger chunk of the user base past the early stage. The team was not running a round of investment at that point and we knew we had to be precise on the use of resources for growth, marketing and scalability.
My mission was to take leadership in mapping opportunities and preparing, designing and driving a strategy towards sustainable profitability, roadmap prioritization and enhanced product standards focused on business growth, tech innovation and user experience.
As a specialist in product discovery and data tracking, I also took on the task to move the product R&D squad towards an agile data-oriented approach on product assessment and user behavior analysis, aiming at improving the quality and outcomes of our internal processes.
Process overview - So, what did we do?
Kick-off discovery - understanding the business, the problem and our user trends
It is well established that one of the most important steps before approaching a challenge with full energy is to deeply understand the goal, context and problem-space you're dealing with, and especially how do they connect and influence each other. I take on this step as a way to avoid falling into solution traps, and to learn more about not only where and how inclined the pain points and opportunities are, but also very importantly where the ideas and desires of stakeholders and the general society are headed.
My initial focus was to gather, review and discuss a variety of internal knowledge sources - from detailed analysis of traffic data to user recordings and interviews - to answer questions about the problem space and competitive landscape, product current situation, trends, and to identify high-influence topics where further investigation is required. This was particularly a very important step to bring insights that would later aid on the prioritization and success of our initiatives.
So, what did I find out?
What's the audience trying to achieve? How does this tool fit into their workflow, and how do they learn about it?
We'd learned that researchers and academics utilized the tool on a non-linear need basis: Close to the submission date of academic papers, conferences, important meetings & lectures. Secondarily, elementary and undergraduate teachers used it as a more frequent resource for the preparation of classes material. They learned about the tool mostly by word-of-month on university resources, online searches for scientific visual assets, papers of colleagues and in-person events such as conference stalls.
What's also available on the market for this problem space? How does the target audience learn about them?
Most researches and educators engaged in scientific communication usually rely on their day-to-day popular tools to prepare visual content: mostly PowerPoint, Google Slides and statistical software.
In similar value proposition, it was evident that there were a couple of competitors on a similar problem space, however none with the same resources-set, user base size or illustrations portfolio as Mind the Graph.
Which are the engagement levels of our current user base, and how are they using the product? Do we have any trends from the most engaged institutions?
We were able to identify and sort 3 key user groups, based on platform behavior and customer status:
Early churners: Users who finish sign up and get started on a creation, but leave after a period of exploration and do not tend to come back other than through reactivation and e-mail marketing.
Soft adopters: Users who get started on a creation, take value out of the curated illustrations and eventually come back for a couple of other publication needs.
Ambassadors: Users who constantly come back for new creations and utilize the platform to its fullest. Through further investigation, it was identified that most of these users acted as references within their companies and universities - and were often assigned with preparing graphical abstracts for their colleagues publications as much as their own.
How does the performance of the conversion funnel look like?
Are there any distinguished behaviors or needs that drive conversion?
In general terms, the tools’ step-by-step conversation rates were matching healthily with the trends of its market, but we decided to aim higher to leverage opportunities to improve this step, as many possible quick-wins had been identified during discovery.
The quality of the source ultimately determined the higher-conversion audiences, highlighting the importance of focusing communication and advertising resources on the specialized audience channels for this particular product.
The quality of the source ultimately determined the higher-conversion audiences, highlighting the importance of focusing communication and advertising resources on the specialized audience channels for this particular product.
Very importantly, a consistent correlation was identified through user flow event-tracking and usage recording analysis: Users who found a large number of related illustrations within their 3 first searches increased their chances of customer conversion by more than 6x
What's our profile of customers, and how long do they stay with us?
Can we see particular trends within recurrent users?
It was important for us to understand not just about to-be customers and target audiences, but also how well we were working with our internal audiences and which were their patterns and trends. Data analysis and surveys helped us explore the following two groups:
a. Monthly subscribers - who tended to be users with lower need for the feature, and signed up mostly to have access to some specific asset for a project they were delivering at the moment.
It corresponded mostly to the demographics of school and university students.
a. Monthly subscribers - who tended to be users with lower need for the feature, and signed up mostly to have access to some specific asset for a project they were delivering at the moment.
It corresponded mostly to the demographics of school and university students.
b. Yearly subscribers - Professors, pharmacists, and in general mid-level to senior professionals who had a larger need to prepare newly scientific content on a frequent basis. They corresponded to highly-loyal customers of tenure up to 260% higher.
These findings were very important to help us understand who were our highest-value customers and how to communicate properly with that audience. It was imperative for the company to pick up the right-fit customers to ensure long-term growth.
Which are our best and worst performing customer acquisition and marketing channels? How is the product positioned on content blogs, search engines and social media?
It was found that audience tailored channels, such as ResearchGate, scientific formatting software,
B2B referrals and traditional marketing methods proved to have better conversion rates and lower CAC on the long run.
B2B referrals and traditional marketing methods proved to have better conversion rates and lower CAC on the long run.
Key Findings, Hypothesis and opportunities
a. Core value delivery to customers: Exclusive illustrations
A fact that particularly caught my attention was that, despite the fact that the product had been branding itself as a online infographic maker tool, it's core value to engaged customers was not the tool itself, but the exclusive gallery of scientifically-accurate illustrations built within the tool - which had at the time been continuously produced in-house by a team of specialized designers and had already summed up to more than 80,000 individual illustrations, templates and sample infographics built for the fields of life & health sciences.
Some key observations on this topic:
Some key observations on this topic:
- At least 60% of engaged customers were using the tool as a source of illustrations, and then exporting those assets into other tools which they were more familiarized with in their work life - such as PowerPoint and Google Slides.
- There was a particular strong correlation into finding abundant illustrations related to their field of study and converting from a free to a paid B2C customer, once a new user had reached the infographic maker workspace.
- Our very own Infographic maker tool presented itself as a ”decent” resource, but would struggle to compete with easy-of-use and speed the user base benefited in popular non-specialized tools. Despite the illustrations, other important resources exclusive to the platform - such as templates and thematic search - were not yet easily discoverable and used.
b. Customer acquisition and conversion funnel - weaknesseses and opportunities
The tool proved out to have some consistent acquisition channels, however still needed to scale into a larger reach to achieve its longer-term growth goals. Even though the conversion funnel had success rates very consistent with the SaaS market, post-subscription refund requests had recently spiked.
Through the conduction of usability testing, funnel analysis and user recordings, many quick-win opportunities were identified to improve the quality of the user flow onboarding and enhance the subscription and value delivery experience on a short timespan.
Through the conduction of usability testing, funnel analysis and user recordings, many quick-win opportunities were identified to improve the quality of the user flow onboarding and enhance the subscription and value delivery experience on a short timespan.
Some key observations on this topic:
- The acquisition channels for such a tool were found out to be quite tailored to its target industry - Engagement in conferences, articles across scientists and academic departments, and research-related platforms were proven to be the most effective sources of users with higher conversion rates and lower CAC, but also with a rather limited reach potential. Google ads were also hypothesized as viable based on search trends, but hadn't previously been largely tested;
- On organic website traffic, the educational and visual content of infographics proved to be the biggest source of visitors;
- Once in the website, the stage-by-stage Drop-off rates were consistent with market standards for SaaS applications, but improvement opportunities based on design standards and user flow mapping were identified;
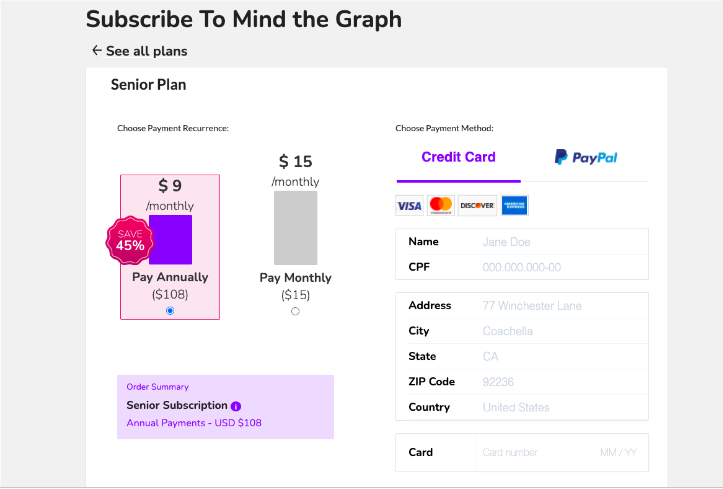
- We realized however that there was a trend of first-month cancellation and refund requests submitted to customer support, which needed further investigation. It was then identified that those were caused mostly by copy and design issues that lead to confusions and double subscriptions on the plan selection and payment flow itself, plus an inconsistent communication about monthly and yearly automatic renewals.
In collaboration with the internal team and interviewed users, several rounds of idealization and discussion were run with the goal to identify opportunities to address our priority topics, resulting in a structured view of next steps and plenty of topics to prioritize and experiment with.
Experimenting and evolving
Now that we had some fair ideas around what's going on with the product, which metrics we could use to properly measure success and the possible relevance of these factors, it was time to test our hypothesis and validate the next best path for product development and customer growth.
For internal alignment, recurrent updates and collab sessions with stakeholders were ran through the course of discovery and experiment checkpoints to refine and update our roadmap - where we focused on discussing available discovery data and experiment updates, and prioritizing opportunities based on projected business value and implementation effort.
On top of running generative & evaluative research, I was personally responsible for formulating hypothesis, running tests and handling the implementation of tools and resources that would grant us with information and speed for evaluation - such as Hotjar, Google Optimize, Inspectlet, Analytics events, and integrated looker (formerly data studio) dashboards.
Updating the Communication and value proposition
On a decision based on estimated financial business impact, audience needs and experimentation speed, our first initiative was to test the way the brand was communicating its value to newbie visitors and customers.
Several rounds of A/B and multivariate tests were ran both on google ads keywords and the website's main page, optimizing copy and identifying the brand positioning that would drive higher-quality users and customers into our platform.
Several rounds of A/B and multivariate tests were ran both on google ads keywords and the website's main page, optimizing copy and identifying the brand positioning that would drive higher-quality users and customers into our platform.
Brand update and cleaning-up the onboarding & conversion funnels
We understood we had found a good opportunity to enhance the quality of the audience we were bringing into the platform - and it was now time to renew our relationship with the userbase and bring a strong positioning and experience to the table.
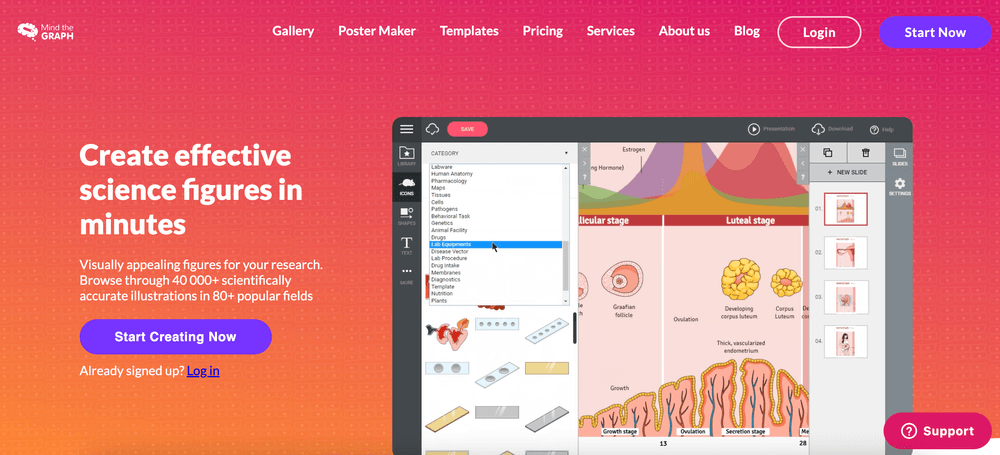
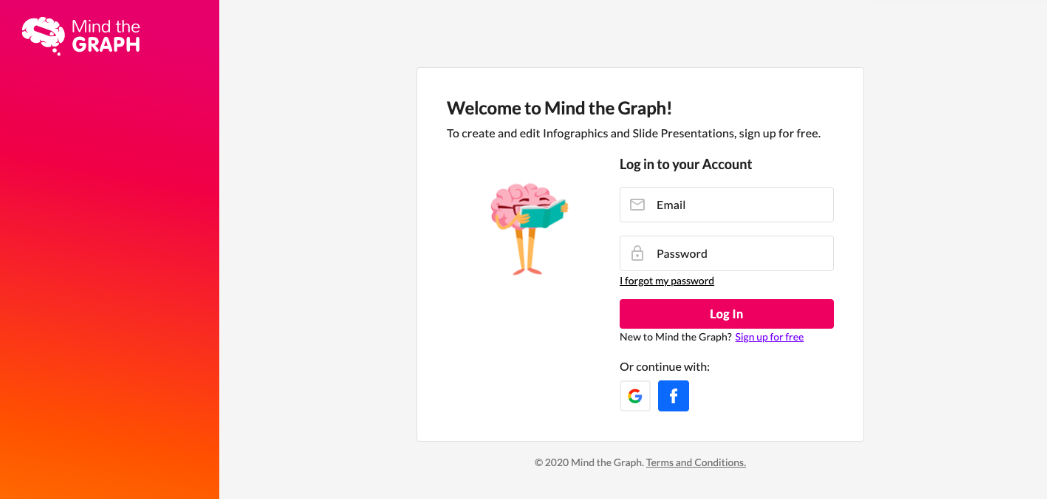
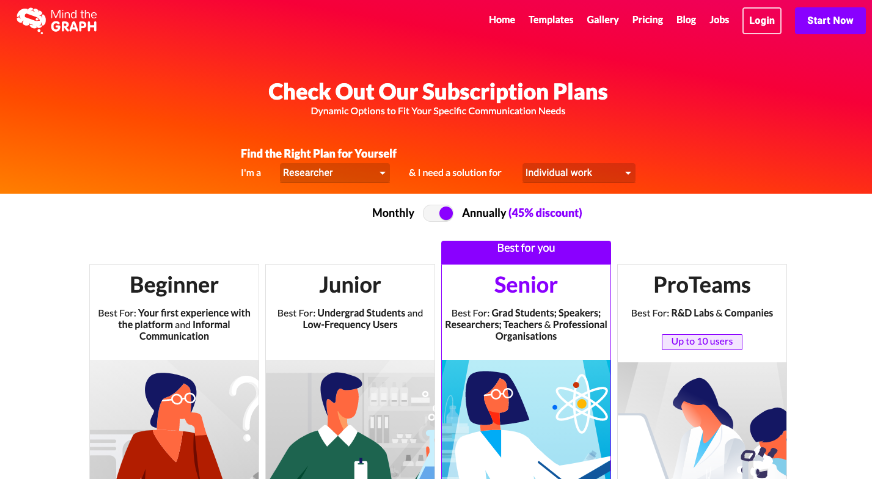
Following our latest quick-win findings, 3 rounds of moderated usability testing and the systematic analysis of around 20 hours of newbie user behavior recordings, I've designed and implemented a new brand scheme - focused on the strong design element of the platform value proposition.
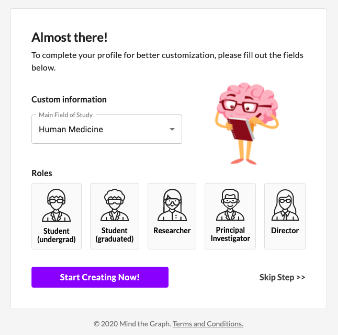
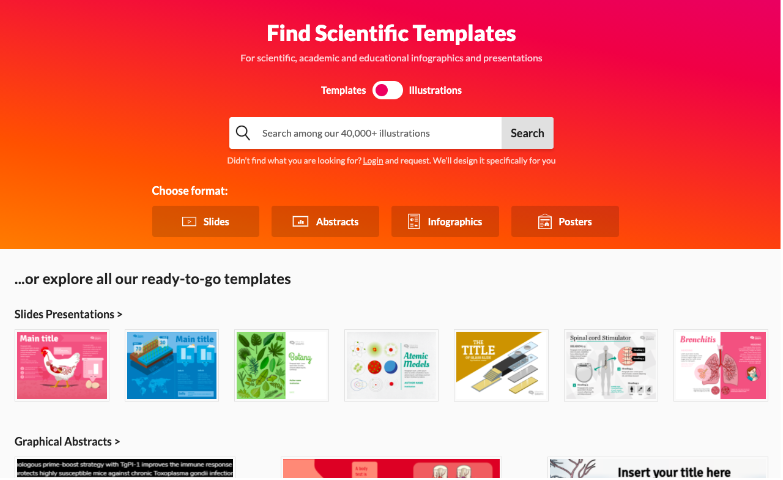
This initiative step included the update of the brand guidelines, social media templates and tone of voice, and most importantly the enhancement of the external website UI and the full sign-up to post-subscription flow. The update of the main page alone generated an increase of 47% on CTA clicks, largely influencing the sign up rates.

Industry leader Illustrations gallery
Once our quick-wins and kick-off experiments had been successfully explored, implemented, and validated, the time of innovating and generating new entry points had come.
Based on our previous findings on the key value the product served to its customers and potential audience, it was evident that the hidden access to the illustrations gallery - only after sign up, and upon exploration of the infographic maker workspace - would be harming our opportunities to highlight the core strengths of the product solution earlier on the user journey.
As the product aimed towards organic and sustainable growth at that stage of development, there was also a high interest to explore the SEO opportunity that each of those scientific illustrations with specialized ontology keywording could provide us, and every illustration page had an express account sign up feature enhanced to aid new-visitor conversion.
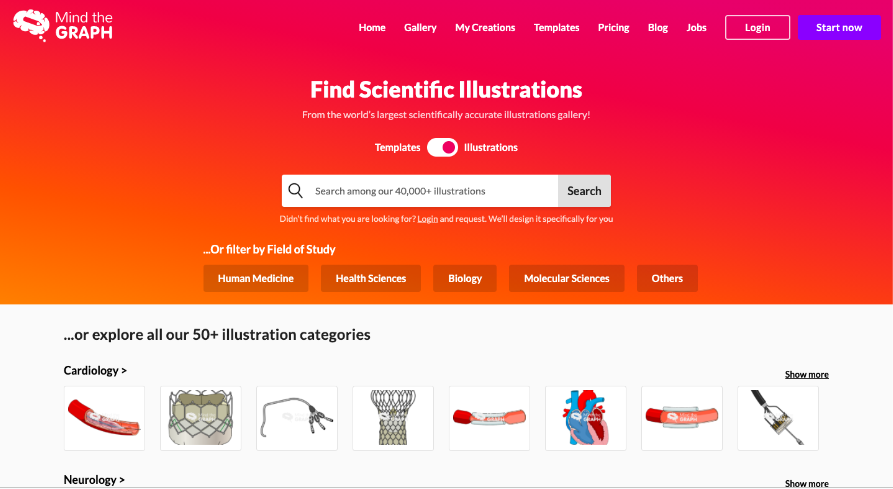
We developed and launched an external gallery with all the illustrations available on the platform, optimized for specialist search and our top-focus scientific fields - such as medicine, chemistry, life sciences and engineering. With time, the gallery was proven to be the largest scientific illustrations set available on the global market, establishing itself as an industry leader for the community and generating increasingly high-quality traffic.
We developed and launched an external gallery with all the illustrations available on the platform, optimized for specialist search and our top-focus scientific fields - such as medicine, chemistry, life sciences and engineering. With time, the gallery was proven to be the largest scientific illustrations set available on the global market, establishing itself as an industry leader for the community and generating increasingly high-quality traffic.
Outcomes, results and after steps
A few months of work and iterations on those initiatives resulted in consistent business metrics improvement across a range of channels - overall building a stronger brand, connected to the right audience and invested towards high conversion, customer satisfaction and customer retention rates.
After the implementation of these improvements and new projects across the years of 2019 and 2020, the successes had been quite impressive and influenced the business onto its growth direction, but it was also just the beginning and many value proposition opportunities that had been gathered could still be tested and leveraged on the market.
I've left the project by mid-2020 to pursue new career opportunities, but I'm glad to see that much of that work is still being leveraged a few years later by the product, which remains in its market leading position releasing innovative communication tools to the scientific community.
I've left the project by mid-2020 to pursue new career opportunities, but I'm glad to see that much of that work is still being leveraged a few years later by the product, which remains in its market leading position releasing innovative communication tools to the scientific community.
And most importantly - what did I learn?
Working on innovative products - Especially in a SaaS business model where every decision matters - is a competitive challenge that I always consider equally delightful and lots of hard work, and being very close to the team proved essential to build good relationships and allow us to tackle complex problems together with efficiency and speed, even in a small-team environment.
Very importantly, we believed that a trade-off between speed and quality was not admissible to the brand and our ultimate goals, so having good analytical skills and the domain of appropriate tools proved to be very useful resources to quickly gather a larger chunk of quality context information, insights and opportunities through research and data.
When it comes to roadmap prioritization, understanding which are your biggest and most feasible impactful opportunities and iterating the value that you are delivering is quite important for sustained success. if you want to remain competitive, high-quality product teams also need to keep an eye on user trends data and ongoing qualitative feedback to not fall into build traps and keep the bigger picture and prioritized goals in mind. The approach to growth we have established is one of mutual trust between product and customers - engaging with the right audience through delivering high-value to the end user, and building an ever improving product that genuinely tackles their needs.
For sustainable growth and success, it is very important that you're not only looking at sales conversions alone, but to a full new relationship you're establishing with customers and what do they expect from your services in a larger timespan. I believe this approach to be the most ethical and sustainable way to grow businesses and products, especially when you're looking into high impact products and building a better and innovative tomorrow.
